AP Research · Academic Paper
Mixed-Methods Historical and Statistical Analysis of American Metrication
Curaçao, 2021
1.Introduction
America is one of only three countries in the world not using the metric system; the other two countries are Liberia and Myanmar. America’s importance in the global economy has caused this issue to affect not just America and its economy, but the entire world. For example, Australia’s switch to the metric system remains incomplete to this day “because of the USA’s strong cultural influence upon us, Australia’s conversion can never be 100%” until America has converted (Wilkes 86). However, American refusal to switch from the imperial system to the metric system has caused even more problems domestically, resulting in millions of dollars in damages. For example, NASA's $125 million Mars orbiter exploded because of confusion with imperial and metric units, wasting $350 million on the total mission equalling approximately $562 million in 2021 United States Dollars (USD) after adjusting for inflation (“1998 Mars Missions” 9). Similarly, the medical errors in the US due to a lack of any uniform measurement whether it be metric or imperial cause 98,000 deaths per year, harm at least 1.5 million people, and cost $3.8 billion after adjusting for the inflation from 2009 to 2021 it equals $4.7 billion per year (Naughtin, “Saving Millions”). During the mid to late 1900s, countries around the world switched to the metric system; even America instituted a plan called the Metric Conversion Act of 1975. However, unlike the many other countries that made the switch at least partially—England, Australia, Canada, and Ireland—America’s plan failed because the switch was voluntary, not mandatory (Naughtin, “Cost of Non-Metrication”). The other difference between the failed American plan and the successful plans of other countries was that America lacked a planned time frame which resulted in perpetual procrastination of the American switch to the metric system (“The United States and the Metric system” 2).
Despite the failure of this plan to convert America to the metric system, there was an amendment passed that succeeded in shifting all government agencies to using the metric system in 1988, and many markets and companies have switched to at least partially using the metric system as a result of convenience in international trade and markets. For example, the food and beverage industry has switched to include either both measurements or just the metric measurement. The Soda industry switched and now labels around the world appear in ounces/gallons or liters/centiliters. The serving size on a pack of Extra gum is labeled as 1 stick (2.7g), a pack of Starburst is labeled as 1 package (58.7g), and all the macronutrients of food items in the nutrition facts are given in grams or milligrams, not pounds and ounces. Despite this prevalence of the metric system in everyday life, Americans still refuse to metricate arguing that it would be expensive, difficult, and unnecessary (Thompson). According to Hillger, President of the United States Metric Association (USMA), another industry that is not in imperial units is the automobile industry (“Ford Motor''). While many aspects of automobiles are provided with imperial units to customers, the manufacturing side is almost completely metric as engine sizes are measured in liters, not gallons. American metrication is becoming easier as companies and industries make the switch on their own to maintain global competitiveness, and America must holistically make the switch so that it can simplify the global market and expand its global market (Hillger, “Ford Motor''). America needs a unified system of measurement to avoid many of these costly expenditures, and the world is publicly and privately moving toward the metric system making it the logical choice for America to adopt as a unified measurement.
The switch from the imperial to the metric system is necessary not only because it is confusing to have two systems of measurement but also because the imperial system is not even uniform: the British gallon and the American gallon are two completely different sizes. When people around the world engage in activities such as fueling planes, this disparity between the two systems needs to be remembered so that complications do not arise. If America decides to switch to the metric system, then an updated plan is required with new data accounting for costs and time required with an end date set. American metrication is not only logical because it aligns America with the rest of the world, but also because it will save America money by preventing some of the many unnecessary costs associated with the lack of uniformity and confusion having and using two systems of measurement causes. However, proving that metrication is the logical choice and will save America money is not possible without new cost estimates, and if America is ever going to metricate, vital research into the optimum plan for American metrication needs to be completed to avoid another failed Metrication attempt. To this end, this study will analyze the data available from previous metrications and metrication research to estimate costs of American Metrication with the goal of building a new plan for metrication.
2.Literature Review
2.1.History of America and the metric system
The American system of weights and measures has been a topic of debate since the country was first established and the constitution written. According to Hodgeback, former Encyclopaedia Britannica editor, even from the creation of the United States government during the 1790s when France invented the metric system, it was debated whether America should adopt the metric system or remain with the English imperial system. However, at the time neither the French nor the Americans chose to adopt the metric system (Hogeback). This decision forever impacted America and resulted in numerous debates and a slow progression toward metrication over the last 150 years. In 1865, US Senator Charles Sumner introduced The Kassen Act (codified as 15 USC 204 et seq.) which “began as a measure to make the use of the metric system compulsory, in the course of debate it was amended to become an Act that simply authorized the use of the metric system” (“MetricationTimeline”). The metric system became legalized in America and established the first imperial to metric conversion table beginning the slow progression of American metrication (U.S. Congress; “Metric Act of 1866”). On May 20, 1875, a major international conference was held in Paris to discuss standards of measurement known as Treaty of the Metre which “provide[s] the basis for a single, coherent system of measurements throughout the world, traceable to the International System of Units (SI)” (“MetricationTimeline”). From 1893, following the Mendenhall Order which declared the meter and kilogram the nation’s “fundamental standards,” the old measures such as yards and pounds were officially defined in terms of the international metric system by the USA, and in 1894 Congress passed a Bill to adopt the metric system, then sent the Bill to a committee: it is still there (“MetricationTimeline”). The legalization of the metric system in American commerce continued into the 1900s when in 1975 America created the Metric Conversion Act of 1975 which continued the conversion of America to the metric system but ultimately failed to succeed in switching America completely to the metric system (Locke). This Act was eventually amended by the Omnibus Trade and Competitiveness Act of 1988 which “designate[d] the metric system as the preferred system of weights and measures for the United States trade and commerce” and required all government agencies” with certain exceptions, to use the metric system in their procurement of, grants and other business-related activities by the end of 1992 (“The United States and the metric system”). This resulted in America adopting the metric system in many ways, and despite the supposed reticence of American citizens to switch, American society is already well on its way to switching to the metric system.
2.2.The 1900s Switching Fever
During the 1900s several countries including Canada, England, Australia, and America, either switched or attempted to switch to the metric system. The only country that failed to switch was America as a result of not setting a true timeline and making the switch voluntary instead of required (“H.R.8674 - 94th Congress (1975-1976)”). All these countries switched, resulting in America being one of only three countries not using the metric system and the only major industrial country not using the metric system (Buchholz). Other countries that switched completely to the metric system were Canada and Australia. Australia and England used 10-year plans that relied more heavily on the theory that a drawn-out plan would be easiest because the government could simply require that as routine maintenance was done or old products replaced, they could be replaced with new ones using the metric system (“Ten Years to Metric;” “UK Progress''). Despite their use of similar plans, they achieved drastically different results. England began the switch but stalled partway through the process of switching as a result of a change in government in 1979 which abolished the board and made the remainder of the switch voluntary (Misachi; “UK Metric Timeline'').
2.3.Private Metric Transitions that Paid Off
Many companies have decided privately to mandate the switch to the metric system because of the confusion caused by having two systems of measurement. These companies include but are not limited to Martin Engineering, Exxon Research and Engineering Company, Ford Motor Company, and IBM. Martin Engineering, a company known for developing bulk material handling solutions, began its metrication in 2012 because of the mix of units that arose creating safety issues and slowing the production process “ma[king] global product sales impossible” (Harrison). The company now uses solely metric units internally but compromised to meet the needs of the American market and includes imperial units in brackets on consumer materials. Similar to Martin Engineering, America needs to metricate to maintain competitiveness in the global market. Exxon’s metrication began in 1972; given its wide global market—operating in over 100 countries at the time—adopting the metric system was inevitable. The company set a 5-year end goal to complete metrication. However, this plan had to be revised as America’s adoption of the metric system continued to be delayed. Despite this, Exxon still went largely metric, estimating their costs to be approximately $830,000 for their research divisions and $1,900,000 for Exxon Engineering provided that these divisions respectively earned on average approximately $200 million (Hillger, “Exxon Research”). Exxon chose to adopt a relatively efficient switch following the belief that the only way to learn the metric system is to use it. Exxon also avoided some costs by switching out long-term machine parts on a normal replacement basis (Glaser 160). While Exxon did not choose to immediately switch every piece of machinery to save costs, they did efficiently replace all of their reports and manuals, opting to use dual units because American metrication in 1975 failed.
While Exxon failed at complete metrication, they did succeed in completely switching almost all of their equipment to the metric system except equipment in America which still uses both units of measure (Glaser 13). In 1971, the Ford Motor company—an American automobile manufacturer—introduced its first metrically-designed four-cylinder engine for its Pinto model: first appearing in the 1974 Pinto. “This was the first production engine designed and built in the US that made complete use of metric engineering standards and achieved compatibility of parts with the four-cylinder engines produced in Ford’s British and German companies'' (Hillger, “Ford Motor''). North American Ford Operations began coordinated metrication starting with the 1978 model vehicles and established a corporate metric conversion policy using a similar plan to Exxon switching imperial systems with metric systems as they need to be replaced to cut costs and effort. Ford’s metrication policy states “all industrial nations are using or are converting to the metric system; continued use of two measurement systems in worldwide multinational operations is incompatible with Ford’s basic objectives'' (Hillger, “Ford Motor''). The lack of uniformity which caused each of these three companies and many others to switch is the very reason why America cannot continue to use both the imperial and metric systems, and continuing to do so will only increase the issues in the future.
2.4.Cost of Non-Metrication
In his paper “Cost of non-metrication in the USA,” Pat Naughtin, MetricationMatters creator, delves into all the ways America is spending money by not switching to the metric system. According to Naughtin, recognized Lifetime Certified Advanced Metrication Specialist by USMA, “[w]hen the Confederation of British Industry (CBI) surveyed its members about metrication in 1980 — after 15 years of British metrication — they found that … the cost of using imperial and metric systems was around £5000 Million every year.” In today’s currency, that is equivalent to approximately $22,019.20 million every year from 1980-2010. The survey went on to find that the “increased production costs were equal to 9% of the companies' gross profit and 14% of their net profit when compared to fully metric CBI companies” demonstrating that by not switching, English companies were wasting money (Naughtin, “Cost of Non-Metrication”). According to Richard Phelps, analyst on education issues in the U.S. General Accounting Office in Washington, another cost of not switching fully to the metric system is that schools waste an enormous amount of time teaching 2 systems of weights and measures—the imperial and metric systems—beyond even the time wasted on teaching 2 systems is the confusion factor many students suffer and lose points on exams due to simple errors in conversions because they have been confused with multiple systems. Naughtin claims beyond this that if Phelps is right and a whole year of math instruction is wasted by teaching dual systems then “assuming that arithmetic and mathematics classes compose about 1/5 of a school curriculum, then mathematics costs 194.4 billion dollars each year … then each year in the USA 16.2 billion dollars is wasted” on teaching dual systems (“Cost of Non-Metrication”).
American society has been debating metrication since the very founding of the country. Ultimately America has decided so far to remain using the Imperial system and has resisted metrication, however, the world as a whole has adopted the metric system and American society is slowly increasing its metric system usage to maintain global competitiveness. Consequently, a dual system of weights and measures has arisen causing numerous issues. America battles with the issues and debate of metrication more each day and if an informed decision is to be made by policymakers and by society new information is needed so that people can understand the implications and the undertaking that American metrication would be. Thus this study will create new cost estimates and data for American metrication to help American society understand how much metrication will cost or actually save them money and establish some benefits and detriments of plans used by other countries which metricated.
3.Method
3.1.Method of Gathering Data
For this study, the data from countries that made the switch to the metric system during the 1900s— England, Canada, and Australia— were gathered for comparison to America’s Metric Conversion Act of 1975. These countries were chosen because they switched to the metric system around the same time as the United States’ attempt in the mid-1900s. Countries which are much smaller than America such as Australia were chosen for this analysis instead of a country more similar in size to America such as Russia because Australia not only entered their switch around the time of the failed American Metric Conversion Act of 1975 but also because they switched from the imperial to the metric system, the same switch attempted by the U.S. Thus, using countries with a more similar situation to America’s despite differences in size or population was used for this study as those differences can be accounted for mathematically using census data which provides differences in road network size and population to determine differences in industrialization and size the two main factors which will impact the cost of metrication. Therefore, these countries provide more complete data about metrication costs. Data specifically on the cost of changing roadway signs, the amount businesses initially spent metricating, the amount subsequently saved by metricating, and how long metrication took were gathered from the USMA, U.S. Government Accountability Office (GAO), Metrication Matters, Australian Government Publishing Service, Canadian Metric Association and UK Metric Association. Data was also gathered from a variety of sources in order to calculate population, measurements, inflation, and conversation rates. Each is listed below with where the information was gathered from.
- The conversion chart for 2021 Australian Dollars (AUD) to 2021 United States Dollars (USD): “Exchange-rates”
- The conversion chart for 1975 AUD to 1975 USD: “U.S. Dollar to Australian”
- The inflation chart: “Inflation Calculator”
- The 1995 Alabama and Canadian data:“Highway Signs”
- The Australian costs of metricating: Reid, Joseph B.
- The population of America, all 50 States, and size data for all 50 States: “Population Estimates” - size data was then converted from square miles to square kilometers.
- The Population of Australia: “National, and State and Territory Population”
- Size data for Australia: “Australia’s size Compared.”
- Size data for America: “Explore All Countries”
- 2018 Road Network size for Australia: “Yearbook 2020 Australian”
- 2018 Road Network size for America: “Table HM-60”
- Road Network Size for all 50 States: “Highway Statistics Series”
3.2.Method of Analyzing
This study used a Mixed-Methods analysis of the data because it allowed for the study of the previous metrication plans and their successes and failures while also allowing for the statistical analysis of the costs. For this study, the plans of each country—the United States, England, Australia, and Canada—that switched during the 1900s were analyzed through a literary and historical analysis to determine why the American plan failed and statistical analysis to determine differences in costs between the plans used to attempt to create a new plan for American metrication as seen in Table 5. To develop this new plan, the Canadian costs of switching highway signs and Australian holistic costs were analyzed to determine the differences in the costs of each plan that was instituted by the different countries. These are the only costs used because those were the only publicly available numbers t as of January 2021. Cost data was then corrected for inflation to 2021 then converted to USD to estimate what the costs would be in today’s USD. From there the cost was divided by the number of square kilometers in the respective country to estimate the rate of the cost per square kilometer which was then multiplied by the square kilometers in the United States to estimate based solely on the size of the landmass if that was the only variable which affected the costs as seen in Table 4. Then from there, that number was multiplied by an average of the population and road network size ratios to get estimates as accurate as possible.
Compound Interest Formula: Future Value = Present Value * (1 + interest rate(inflation))^number of times interest compounded
        CPI Formula: Final value = Initial value * CPI final/CPI initial
Table 1:
$3,800,000 * 74.12% = $6,616,403.36
$13,400,000 * 74.12% = $23,331,527.62
$420,000,000 * 74.12% = $731,286,686.71
FV = PV (1 + i)^n
$3800000 * (1 + 0.02)26 = $6,611,900.6
Final value = Initial value * CPI final/CPI initial = $3,800,000 * 109.9/63.16 = $6,611,900.6
FV = PV (1 + i)^n
$13400000 * (1 + 0.02)26 = $23,315,649.47
Final value = Initial value * CPI final/CPI initial = $13,400,000 * 109.9/63.16 = $23,315,649.47
FV = PV (1 + i)^n
$420000000 * (1 + 0.02)26 = $730,789,013.24
Final value = Initial value * CPI final/CPI initial = $420,000,000 * 109.9/63.16 = $730,789,013.24Table 2a calculating for inflation of Australian Dollar then converting to USD
15,955,000 (1971 AUD) * 1,072.5% = $187,073,126.80 (2021 AUD) * 0.78 = $141,207,641.89 (2021 USD)
FV = PV (1 + i)^n
5,955,000(1971 AUD) * (1+0.05)^50 = $68,160,.678.13
FV = PV (1 + i)^n
$10,000,000 * (1 + 0.05)^50 = $117,200,036.57
FV = PV (1 + i)n
$15955000 * (1 + 0.05)50 = $186,992,658.34
Final value = Initial value * CPI final/CPI initial = $15,955,000 * 108.85/9.29 = $186,992,658.34Table 2b Adjusting 1981 AUD for inflation to 2021 AUD then converting to 2021 USD
15,955,000 (1981 AUD) * 331.07% = $68,776,893.13 (2021 AUD) * 0.78 (Inflation rate as of Feb 2021) = $53,663,858.63 (2021 USD)
Future Value = Present Value * (1 + interest rate(inflation))^number of times interest compounded
FV = PV (1 + i)^n
$5955000 * (1 + 0.04)^40 = $25,659,055.21
FV = PV (1 + i)^n
$10000000 * (1 + 0.04)40 = $43,088,253.92
FV = PV (1 + i)^n
$15955000 * (1 + 0.037935)39 = $68,160,678.10
Final value = Initial value * CPI final/CPI initial = $15,955,000 * 108.85/25.26 = $68,747,309.13Table 2c Converting to USD then calculating for inflation
15,955,000 (1975 AUD) * 1.303780965 = $20,801,825.30 (1975 USD) * 402.22% = $104,470,663.03 (2021 USD)
FV = PV (1 + i)^n
$7764015 * (1 + 0.03)46 = $38,965,802.12
FV = PV (1 + i)^n
$13037809 * (1 + 0.03)46 = $65,433,758.9
FV = PV (1 + i)^n
$20801825 * (1 + 0.03)^46 = $104,399,566.05
Final value = Initial value * CPI final/CPI initial = $20,801,825 * 109.9/21.9 = $104,399,566.054.Results
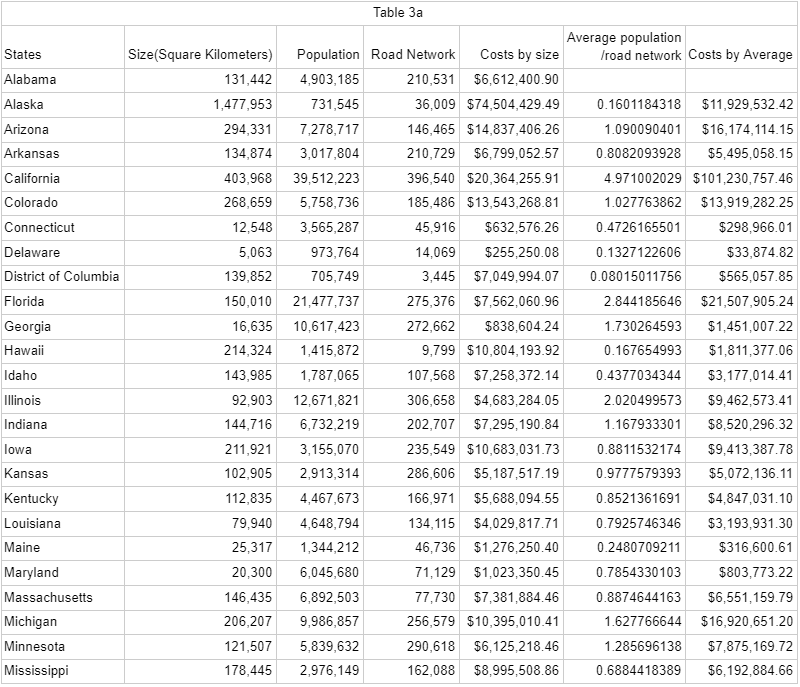
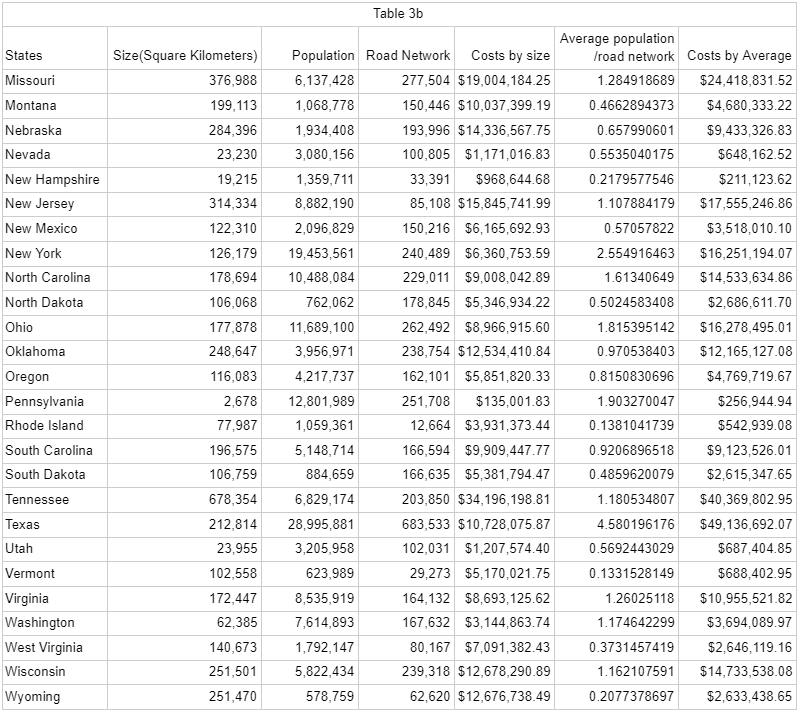
Table 1 introduces cost estimates for changing the Highway signs from the imperial to the metric system. Therefore, those estimates were made using the estimated 6 million road signs at the time which would have needed to be converted to metric units. Alabama was included with Canada and the United States (Table 1) because it was the only state with available data which helped to determine what a representative state would cost to convert roadway signs to the metric system. The full calculations can be seen in Appendix A Tables 3a and 3b and includes estimates for all 50 states based on the data from Alabama and correcting for the differences in road network and population to create more holistic estimates for the states to metricate instead of just costs to metricate highway signs.
| Costs of Switching Highway signs | 1995 | 2021 |
|---|---|---|
| Alabama | $3,800,000 | $6,612,403.36 |
| Canada | $13,400,000 | $23,331,413.71 |
| United States | $420,000,000 | $731,286,686.71 |
Tables 2a, 2b, 2c and 2d estimate the holistic cost of American metrication using data from Australian metrication. The population data is the most recent census data available. The road network size is from 2018 for both countries as it is the most recent data available for both countries. The holistic estimates were created using Australia’s metrication costs from 1971-1981 (15,955,000 AUD) then adjusting for inflation and converting to USD which equals $145,965,677.92 then multiplying that by the average of the differences in road network and population. America has a 13 times larger population and a 8 times larger road network creating an average of approximately 10.5. Multiplying $145,965,677.92 by the ratio of the size difference in square kilometers —9,834,184.86/7,692,264.69=1.27845— creates an estimate based on size difference alone American metrication would cost $180,526,909.80. This is then multiplied by the average shown earlier (10.5) which creates a more accurate estimate that accounts for differences in population and road network as well resulting in the holistic estimate of $1,959,403,120 for American metrication.
| Costs of Switching Australia | Metric Conversion Board | Commonweath Government | Total |
|---|---|---|---|
| AUD(1971) | $5,955,000 | $10,000,000 | $15,955,000 |
| AUD(2021) | $69,822,655.60 | $117,250,471.20 | $187,073,126.80 |
| USD(2021) | $54,479,825.26 | $91,485,852.66 | $145,965,677.92 |
| Costs of Switching Australia | Metric Conversion Board | Commonweath Government | Total |
|---|---|---|---|
| AUD(1981) | $5,955,000 | $10,000,000 | $15,955,000 |
| AUD(2021) | $25,670,097.06 | $43,106,796.07 | $68,776,893.13 |
| USD(2021) | $20,029,349.93 | $33,634,508.70 | $53,663,858.63 |
| Costs of Switching Australia 2 | Metric Conversion Board | Commonwealth Government | Total |
|---|---|---|---|
| AUD(1975) | $5,955,000 | $10,000,000 | $15,955,000 |
| USD(1975) | $7,764,015.65 | $13,037,809.65 | $20,801,825.30 |
| USD(2021) | $38,992,338.16 | $65,478,319.84 | $104,399,566.05 |
| Country | Population | Road Network(Kilometers) | Size (Square Kilometers) | Costs(2021 USD) |
|---|---|---|---|---|
| Australia | 25,360,000 | 823,000 | 7,692,264.69 | $145,965,677.92 |
| United States | 328,200,000 | 6,580,000 | 9,834,184.86 | $186,609,820.90 |
| Ratios | 12.9416 | 7.99514 | 1.27845 | |
| Total | $1,959,403,120 |
| States | Size(Square Kilometers) | Population | Road Network | Costs by size | Average population /road network | Costs by Average |
|---|---|---|---|---|---|---|
| Alabama | 131,171 | 4,934,190 | 211,339 | $6,612,400.90 | ||
| Alaska | 1,477,953 | 724,357 | 31,597 | $74,503,610.73 | 0.1481561194 | $11,038,165.85 |
| Texas | 676,587 | 29,730,300 | 29,730,300 | $34,107,116.03 | 75.62248218 | $2,501,778,222.89 |
| Rhode Island | 2,678 | 1,061,510 | 12,741 | $134,999.43 | 0.1377103076 | $18,590.81 |
| District of Columbia | 158 | 714,153 | 3,454 | $7,964.87 | 0.08053951023 | $641.49 |
| Country | Size(square miles) | Costs(2021 USD) | rate |
|---|---|---|---|
| Australia | 2,970,000 | $141,207,641.89 | $47.54 per Square Mile |
| United States | 3,797,000 | $180,509,380.18 |
| Country | Time | Effectiveness |
|---|---|---|
| Canadian Plan | Planned from 1971-1980 finished action by 1984 | Nearly complete metrication of Canada. Halted when a new administration took over and hindered by American use of the imperial system |
| Australian Plan | 1971-1981 | Complete successful transition except for the influence of the US in Australia |
| English plan | Planned to take 10 years; 1965-1975, 1995, 2004 | Semitransition of England to the Metric System. Stuck in a transition state for years as they have both units and English Metrication has stopped |
5.Analysis
5.1.Analysis
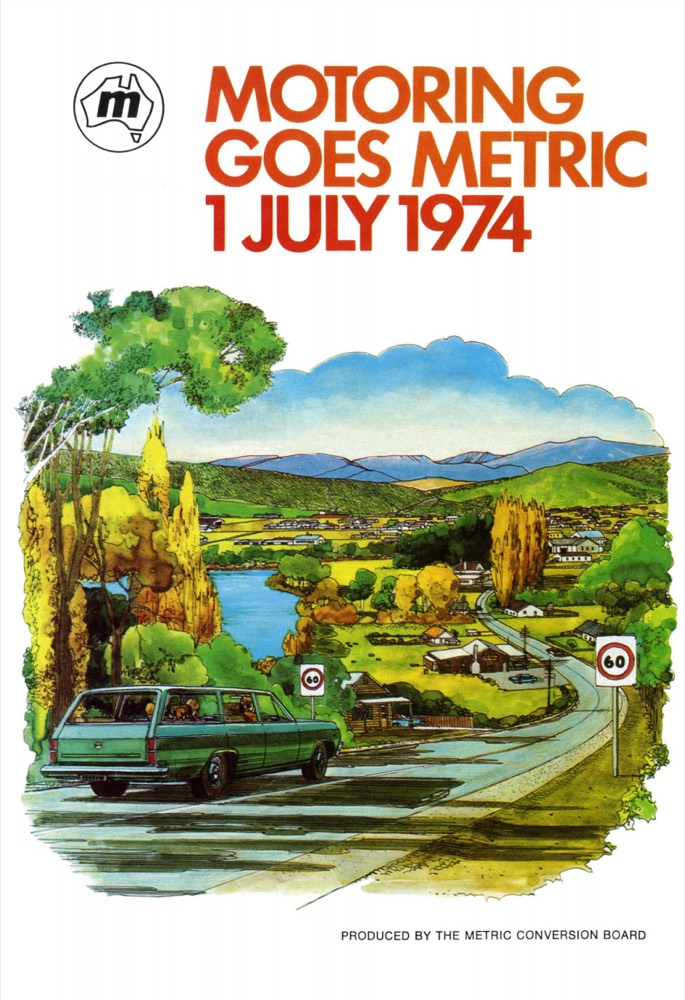
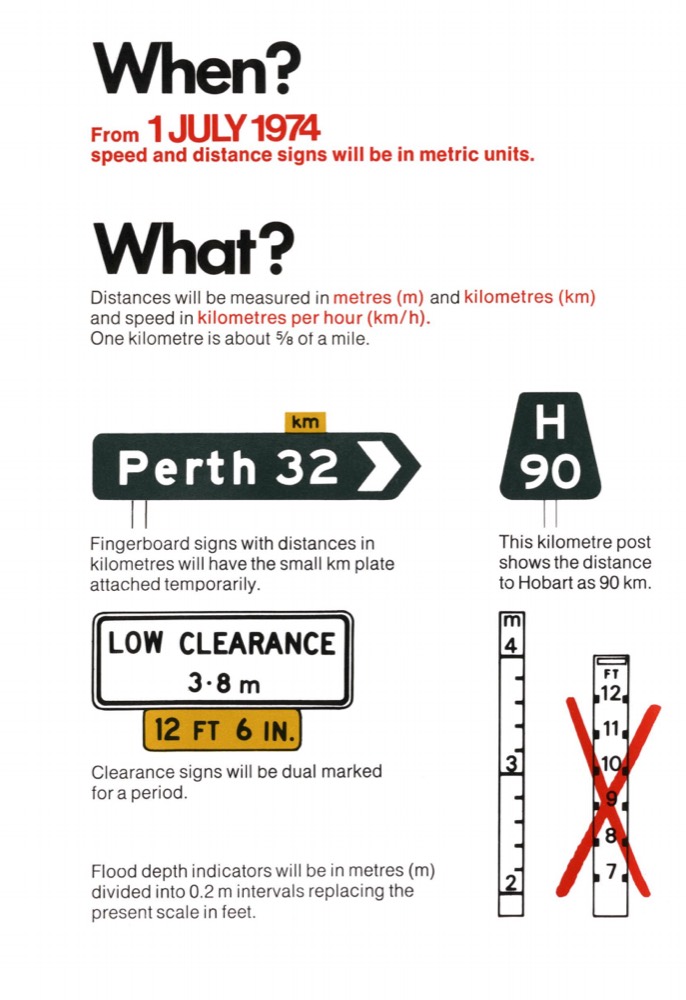
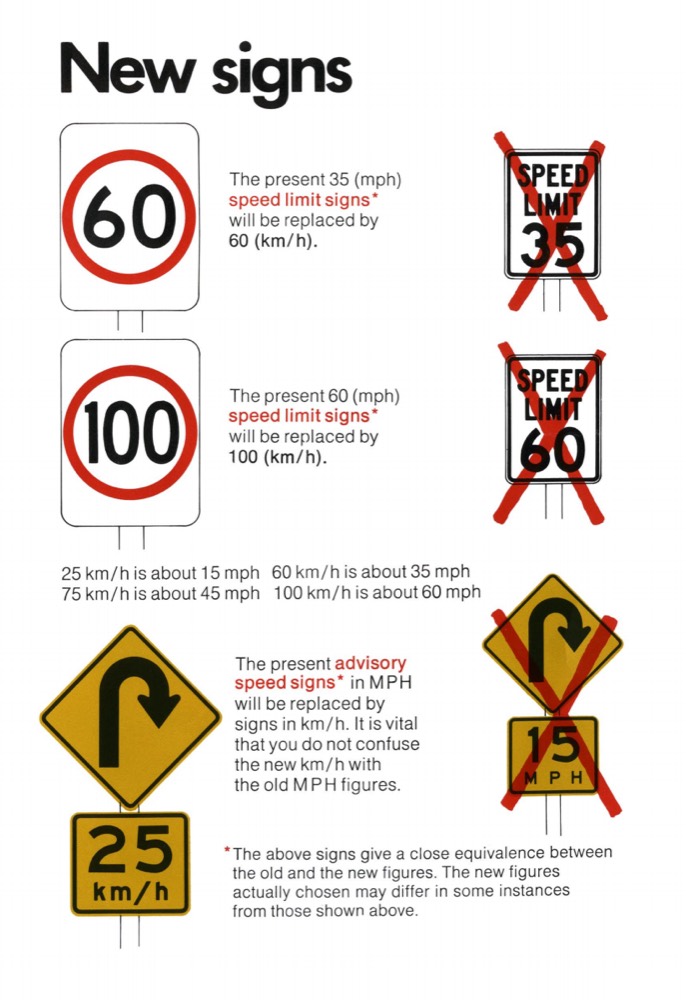
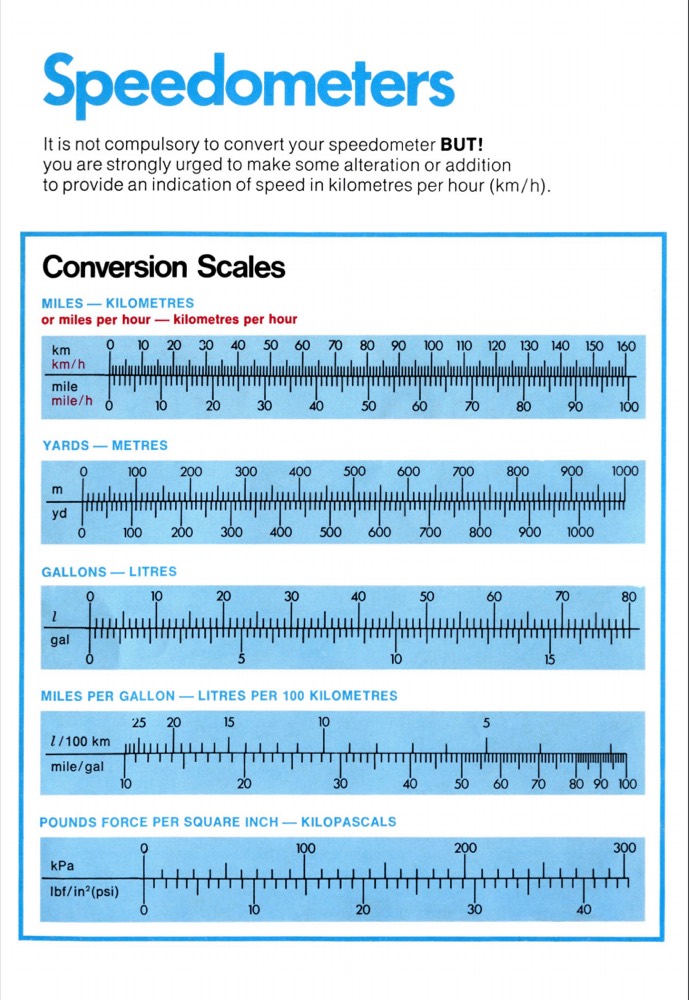
Ultimately, according to the data in Tables 2d, the cost of American Metrication would be less than half of the $3.8 billion wasted in hospitals per year as a result of confusion with having two systems of measurement (Naughtin, “Saving Millions”). There are three common types of plans being proposed or used by companies or other countries: fast immediate switches which have an increased initial cost but avoid confusion by completing the conversion quickly, a two-phase plan with some increased initial cost but minimal confusion, and the long plan which cuts costs but has a chance for much confusion. The problem with the two-phase plan is that it requires all non-metric products to be replaced twice and it acts as a crutch to avoid forcing people to switch. The long plan goes through and efficiently switches systems, but it is done systematically and does not attempt to do everything all at once. During this time things such as machines in factories and highway signs are replaced through routine maintenance schedules which cut down the cost while also effectively switching to the metric system. Using a longer plan that switches to the metric system in 5 to 10 years will eliminate costs because the main expense—highway signs—will already have to be paid for through routine maintenance whether they are replaced with new metric signs or just replaced with the same imperial units so the only change that is made is what the signs are made to say. The Australian metrication pamphlet distributed by the Metric Conversion Board can be seen in Appendix B (“Motoring Goes Metric”).
Australia’s metrication plan serves as a template for an American switch as they did not spend a fortune making the switch and they were ultimately successful apart from American involvement in their economy. The Australian plan allows for an inexpensive switch to the metric system while avoiding confusion; this is achieved by reducing the costs of replacing machines and non-metric products through routine maintenance costs and by reducing one of the largest metrication costs by replacing new highway signs through routine maintenance next to the original signs, while covered, and then removing all the coverings and imperial signs at once (Wilkes). Australia’s use of the long plan systematically metricating affords ample time to ensure the public learns and becomes accustomed to the metric system equipped with the capability to use it in their daily lives.
In 1977 Canada spent equivalent to $23 million in 2021 U.S. Dollars or $95.60 per sign to switch 241,000 signs on 300,000 miles of highway in 2 months. This is equivalent to the highway miles in California and Texas (Circa 1995) America on the other hand would need to convert 6 million signs (Circa 1995) from the imperial to the metric system meaning any sign with an imperial measurement (i.e., speed limits, mile markers, distance to exit) which would cost $334 million 1995 US Dollars or $574 million 2021 US Dollars (“Highway Signs”). In October 1995 Alabama created estimates for switching their road signs to metric to cost $2.7 million later they increased it to a $3.8 million estimate. According to these estimates switching American highway signs would cost $420 million US circa 1995. The switch would’ve cost $389 million in 1975 when the initial plan was released, in 2021 that would cost $1.89 billion. That is an increase of 387%. Beyond this, that data will still be less than the actual costs because it only accounts for inflation of the dollar value from 1975 and does not account for any development which could have and most definitely did occur when those cost estimates were made. Now is the time to make the switch as companies are already deciding to universally use the metric system or use both to accommodate America. Society is more prepared than ever for the switch and metrication is only rising in cost the longer the switch is delayed.
5.2.Implications
One of the problems will be switching the car industry, however, many car companies such as Ford have already completely metricated and all car engines use the metric system (Hillger, “Ford Motor”). Of course, newer cars will not be a problem because they are made using digital displays most of which can be changed in the settings from metric to imperial and those that don’t already have that setting but have a digital display can be given a simple software update which resolves this. Older cars are the main problem because they came before digital displays. The question becomes whether or not it is necessary to entice people with older cars to replace their system with the metric system and how they would be enticed. Australia had its own solution for motivating people who otherwise had no reason to take action: They opted to impose fines on those who did not convert their products to metric (Reid). Whether or not this was the best solution cannot be determined because there are no other solutions for comparison. That said it is an effective method as Australian metrication was successful. Another benefit of the longer switch is that some of the older cars on the road will be replaced with newer cars meaning fewer cars with non-metric units, and incentives could be offered for people with classic cars to switch their cars to the metric system. There are however ways to replace it at home if one gets an appropriate dashboard it can be easily done at home. The problem is that those dashboards in classic cars were not in high demand so they would have to be manufactured on a large scale for people to buy or for the government to give away. The part that will be unchangeable at home is the odometer, but the odometer continuing to read out the distance the car has on its engine in miles is something that will either have to be altered by the manufacturer if possible or it will just remain in miles.
5.3.Limitations
America needs to move to the metric system and to do that the government must take the time to make more exact numbers than the ones presented in Tables 1, 2a, 2b, 2c and 3a. While they are reasonable estimates which will ultimately be approximate to the actual costs of metrication to help prove that metrication is the logical choice it is unfortunately impossible to estimate numbers in this way and be fully accurate because these estimates relied on data from other countries and accounting for differences.
5.4.Next Steps
Future researchers would need to determine more accurate road network census data. In this study census data from 2018 was used for the Australian data as that was the last available data from both countries, and for the highway sign costs in table 1 census data from 2017 was used because that was the last available data. The most accurate cost data would come by finding the most recent differences and determining how many signs, machines, factories, and industries there are in America which require metrication and then commissioning cost estimates from the manufacturers of these products. The American government also has a much wider range of concerns to consider when making such a decision so for American metrication to move forward the government would need to review everything involved in the switch and consider things that were not included in this analysis. That and the government has resources and data at its disposal to achieve far more accurate data than could ever be achieved through this research’s estimates. The future of American Metrican lies in the government enacting laws to make the switch, gathering cost estimates, and deciding exactly which plan it believes will be best for the American society. Researchers would need to determine exactly how much of and which parts of American society need to metricate before America could develop the necessary cost data for metrication to fully occur. However, America can avoid some concerns which other countries such as Australia, England, and Canada had to deal with. The main one is having to trade with a major economy still using the imperial system which is partially what halted their switches to the metric system (Reid). Metrication is not only the logical choice for America to make but it is only becoming more expensive as the transition is repeatedly delayed.
6.Conclusion
America needs to metricate to maintain competitiveness in the global market and to simplify its society. Metrication would resolve many of America’s issues and save it a ton of money currently being wasted by unifying America’s system of weights and measures. Despite the beliefs of many Americans, metrication has already begun and the divide it has created only complicates society. Unfortunately, the only way to heal this divide is for America to completely metricate because the metricated parts of America are not returning and diverging from the global markets in which they metricated to maintain their competitiveness. Thus metrication is the logical future for America to avoid many of these unnecessary expenses.
Works Cited
- “1998 Mars Missions.” National Aeronautics and Space Administration(NASA). Dec 1998. Web. 16 Dec 2020.
- “Australia's Size Compared.” Australian Government | Geoscience Australia. 2018. Web. 19 May 2021.
- Buchholz, Katharina. “Only Three Countries in the World (Officially) Still Use the imperial System.” Statista Media. 6 Jun 2019. Web. 22 Sep 2020.
- “Exchange-Rates.org World Currency Exchange Rates and Currency Exchange Rate History.” MBH Media. 2021. Web. 19 May 2021.
- “Explore All Countries— United States.” Central Intelligence Agency. 11 May 2021. Web. 19 May 2021.
- “Fair Packaging and Labeling Act: Regulations Under Section 4 of the Fair Packaging and Labeling Act.” Federal Trade Commission. 4 Mar. 2020. Web. 12 Oct. 2020.
- Glaser, Marvin B. "Metrication at Exxon Research and Engineering Company," ANMC Conference, April 5-7, 1976, Washington, D.C. Conference Presentation.
- Harrison, Paul. “Metricating Martin Engineering.” US Metric Association. Jan 2020. Web. 13 Jan 2021.
- “Highway Signs: Conversion to Metric Units Could be Costly.” U.S. Government Accountability Office. 7 Jul 1995. Web. 10 Oct 2020.
- “Highway Statistics Series.” U.S. Department of Transportation/Federal Highway Administration. 30 Sept. 2020. Web. 19 May 2021.
- Hillger, Don. “Exxon Research and Engineering Company.” US Metric Association. June 2019. Web. 16 Oct 2020.
- ---. “Ford Motor Company’s switch to metric.” US Metric Association. May 2017. Web. 5 Dec 2020.
- “Highway Signs: Conversion to Metric Units could be Costly.” United States General Accounting Office. 7 July 1995. Web. 17 Feb 2021.
- Hogeback, Jonathan. “Why Doesn’t the U.S. Use the metric system?” Encyclopædia Britannica, Inc. Web. 22 Sep 2020.
- “H.R.8674 - 94th Congress (1975-1976): An Act to declare a national policy of coordinating the increasing use of the metric system in the United States, and to establish a United States Metric Board to coordinate the voluntary conversion to the metric system.” Library of Congress. 23 Dec 1975. Web. 22 Sep 2020.
- “Inflation Calculator.” Inflation Tool. 2021. Web. 19 May 2021.
- Locke, Susannah. “It’s Time for the US to use the metric system.” VoxMedia, LLC. 20 Dec 2014. Web. 22 Sep 2020.
- “Metric Act of 1866.” US Metric Association. 3 Aug. 2020. Web. 12 Oct. 2020.
- “MetricationTimeline.” MetricationMatters. 2008. Web. 9 Dec 2021.
- Misachi, John. “Does England Use the metric system?” WorldAtlas. 27 Aug. 2019. Web. 12 Oct 2020.
- “Motoring Goes Metric.” Australian Government Publishing. 1Jul 1974. Web. 19 Jan 2021.
- “National, State and Territory Population, September 2020.” Australian Bureau of Statistics. 18 Mar. 2021. Web. 19 May 2021.
- Naughtin, Pat. “Cost of Non-Metrication in the USA.” Metrication Matters. 2008. Web. 12 Oct 2020.
- ---. “Saving Millions with the metric system.” TED Conferences LLC. 2009. Web. 20 Jan 2021.
- Phelps, Richard. “The Case for U.S. Metric Conversion Now.” Editorial Projects in Education. 24 Feb. 2019. Web. 12 Oct 2020.
- “Population Estimates.” U.S. Department of Commerce. 1 July 2019. Web. 19 May 2020.
- Reid, Joseph B. “Metrication of Australia.” Canadian Metric Association. 1992. Web. 5 Dec 2020.
- “Table HM-60 - Highway Statistics 2018 - Policy: Federal Highway Administration.” U.S. Department of Transportation/Federal Highway Administration. 30 Aug 2019. Web. 19 May 2021.
- “Ten Years to Metric.” Science News, vol. 97, no. 14, 1970, pp. 340–340. JSTOR, www.jstor.org/stable/3954881. Accessed 22 Sept. 2020.
- “The United States and the Metric system.” National Institute of Standards and Technology. Oct 1997. Web. 22 Sep 2020.
- Thompson, Elizabeth. “The Reasons Why the U.S. Should Not Use the Metric System.” Leafgroup Media. 09 Jan 2018. Web. 19 Mar 2021.
- “UK Metric Timeline.” UK Metric Association. 16 Aug. 2020. Web. 12 Oct. 2020.
- “UK Progress.” UK Metric Association. 25 July 2017. Web. 12 Oct. 2020.
- U.S. Congress. United States Code: Weights and Measures and Standard Time, 15 U.S.C. §§ 204-267 Suppl. 4. 1964. Periodical. Retrieved from the Library of Congress, <www.loc.gov/item/uscode1964-020015006/>.
- “U.S. Dollar to Australian Dollar Spot Exchange Rates for 1975 from the Bank of England.” Pound Sterling Live. 2021. Web. 19 May 2021.
- Wilkes, Kevin. "Metrication in Australia A Review of the Effectiveness of Policies and procedures in Australia’s conversion to the Metric system.” Australian Government Publishing Service. 1992. Print. 10 Jan 2021.
- “Yearbook 2020 Australian Infrastructure Statistics.” Australian Government Department of Infrastructure, Transport, Regional Development and Communications. 2020. Web. 19 May 2021.
Appendix A · Tables 3a and 3b, all fifty states
These two tables are images in the original document. They are reproduced here as they appear there rather than retyped, because three hundred and fifty figures transcribed by eye is how an error gets into a number nobody checks again.
Appendix B · Motoring Goes Metric, Metric Conversion Board, 1974
The Australian pamphlet cited in the analysis, reproduced from the original scan.